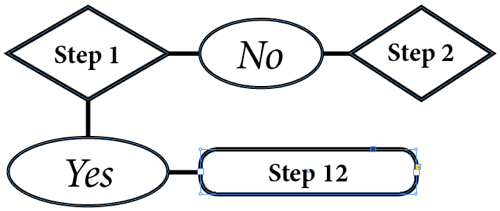
Building an Org Chart or Flowchart in InDesign, Part 3
In part 1 and part 2 of this (rather extended) series on creating an organization chart, or a flow chart, I covered making the frames and aligning them. Now it’s time to put ’em together with lines.
I recommend that people draw as few lines as possible in a flow chart. For example, instead of drawing four separate lines to connect these five frames, I’ve drawn one with the Pen tool:

The reason is clear: as you’re moving frames around, adjusting the spacing and so on, it’s a hassle to keep lots of little tiny lines in alignment, too. Instead, here, we can move frames around along the lines and just worry about shifting the “flow” line occasionally.
Of course, we don’t want the lines overlapping the frames. So we ensure the frames have an opaque color (such as Paper), select the line, and choose Object > Arrange > Send to Back:

I also adjusted the frames so that they’d align with the line a bit more.
Sometimes people want to add arrows between each frame, to indicate direction. There are a couple of ways to do this. You could just draw a small triangle and place it over the line where you want it. (If you do this, consider grouping the triangle and the frame that it’s pointing to, so if you move the frame, the triangle comes along for the ride.) Or you could just give up on the “few as possible” lines idea and just draw an individual line between each object. Use the Stroke panel to give the lines an arrow endcap:

I’ll leave you with a couple additional tips: Sometimes you need the same frame or line repeated a number of times (with equal space between them), but you’re not sure how far apart they should be. For example, in this image, I want to draw four vertical lines that drop from the horizontal line down to the minions:

To achieve the effect, I drew one line, then held down the Option/Alt key and started dragging it (which makes a duplicate of the original). Then I let go of the Option/Alt key (while still holding down the mouse button), and I pressed the right arrow key on my keyboard two times. This invokes the “gridify” feature, creating a grid of duplicates, equally spaced. (Note that this was new in CS5.) Finally, I held down the Shift key to position the right-most line (shown in the image above). When I let go of the mouse, all four lines are placed just where I want them.
Later, I realize that the chart is too wide, and I need to make it narrower. So I first select all the “minion” frames and the short lines that feed into them:

Then — and here’s the tricky part — I hold down the Option/Alt key and start dragging the left or right side handle (again, CS5 or later). Because I held down Option/Alt, the transformation (widening or narrowing the group) will be mirrored; that is, if I drag the right side handle to the left, the left side handle moves to the right (so the whole thing gets narrower but stays centered).
But — before I let go of the mouse button! — I hold down the spacebar key (so both spacebar and option/alt are down). Finally, I drag the side handle until it looks right, and I let go of everything. The spacebar-after-dragging trick is interesting: It means redistribute the space between the objects instead of resizing the objects themselves. Cool, huh?
All they keyboard shortcuts definitely take some getting use to, but when you’re building a complex chart, they make the layout fly so much faster.


Ah, but there’s this really handy plug-in from DTP Tools that helps with remembering keyboard shortcuts and lots of other stuff. Perhaps you’ve heard of it. :-)
Hi,
Are there any templates for building tournament type bracket charts? I run pool tournaments an need to create (single, modified single and double) elimination tournament charts including player names. Thanks in advance for your assistance.
Minion, Minion, Minion… you crack me up!
I thought you were going to do the boxes around the type with some kind of paragraph style and then use anchored object or something. Or perhapps use a table merging cells and choosing to stroke certain borders to build the structure? but no? well then a tip is to place your chart elements in snippes or as library items so you can easily re-use them.
Looks like a great opportunity to use some object styles!