

Creating Instant Charts With Chartwell

One of the coolest things I saw at the InDesignSecrets Print and ePublishing Conference back in May was during the final tips and tricks session, when Michael Ninness wowed the crowd by showing us a font that automatically converts numbers into charts and graphs. The font is called Chartwell, and it was developed by Travis Kochel. Travis recently sent us a free copy so we could review it here. Thank you, Travis!
Chartwell uses a head-smackingly clever method of employing ligatures to swap number glyphs with ones that resemble components of bar, line, and pie charts.
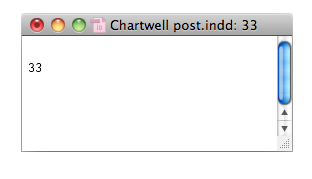
For example, to create a pie chart wedge that approximately represents one third of a circle, first type “33”.

With the text selected, confirm that it’s set to use ligatures.
![]()
Then change the font to Chartwell Pies.
![]()
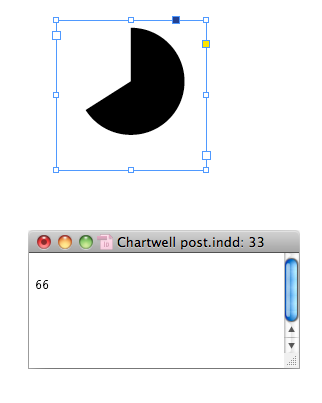
The number glyphs are instantly swapped out for a pie piece that accurately represents 33% of the pie.

If you look in the Story Editor, you can see your “33” and edit it.
Change it to “66” to make a wedge approximately two-thirds of the whole pie.
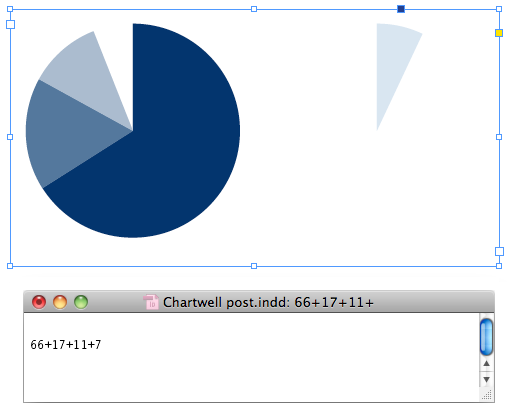
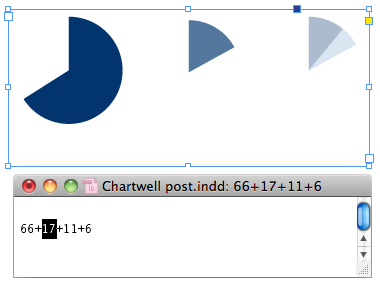
If you want a pie with multiple wedges, you enter a string of whole numbers separated by + signs. The pie pieces are arranged clockwise around the circle. You can apply a different color to each number to distinguish the wedges.

If the values add up to more than 100, the piece that won’t fit becomes the start of a new graph.
Chartwell also contains regular letter and number glyphs, so you can quickly switch back and forth between numbers and charts without switching fonts, just by turning ligatures off and on.
After you’ve created a chart, you can modify the look of it. You can select a whole chart and apply scaling or skewing if you like.
And there’s nothing stopping you from creating paragraph styles that use Nested Styles or GREP styles, for automated formatting.

But if you try to do anything tricky like mixing font sizes or formatting other than color within a chart, it breaks into pieces. Like here I changed the font size applied to the number “17.”
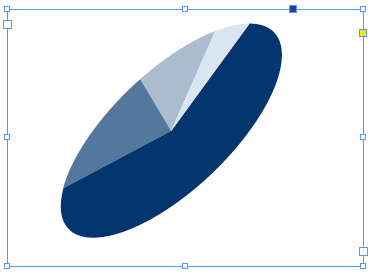
You can of course also convert Chartwell charts to outlines and then transform them to your heart’s content. Here, I made an extruded version of the pie chart by converting a copy to outlines and reshaping the pieces into the sides of a cylinder with the Pen tool.

You can also create ring-shaped charts by adding a letter at the end of the string of numbers.

The size of the circle in the center is determined by the letter, ranging from lowercase a to uppercase Z.
The font also comes in versions for line charts:

And bar charts.

Each Chartwell font is $20, or you can purchase the whole set for $50. Each one also comes with webfonts and a javascript plug-in that makes the glyph substitutions for online use. You can read the details of how to use Chartwell Web here. [2013 Update: More chart styles have been added, the price has gone up a little bit, and it is now sold by Vectro Type; more information here.]
About the only negative I’ve found is the limitation of working only with whole numbers. It means that you can’t have something like a pie chart perfectly divided into thirds. The closest you can get is to have wedges of 33%, 33%, and 34%. But this is a pretty small tradeoff in most cases for the awesomeness of automatic charts, courtesy of Chartwell.
What about doing 33.3%?
I’m <3ing this
Eugene-
Each time you enter a decimal, Chartwell starts a new chart. So if you enter “33.3” you get 2 charts, one with a piece representing 33 and a second chart with a piece representing 3.
33.3+33.3+33.3 gets you four charts, like this: https://yfrog.com/kf9vqup
Brilliant!!! I must have this font!
That’s very impressive, congrats to author ;)
I love this font too. Imagine what you can do with it when linked to an database combined with DataMerge or XML…
One other thing I forgot to mention in the post: Chartwell works in InCopy, Photoshop, and Illustrator too.
Very nice.
Do any of you have a suggestions of apps or plug-ins to use if you want column and bar graphs to be editable in InCopy?
Is it simply not possible?
Hi Nina-
Chartwell works fine in InCopy too. You’d just have to be sure you had text frames large enough to accommodate the chart you were making, and work in the Story view to see and edit the numerical values.
Chartwell,
Where have you been all my life?
Without wishing to be too intellectual…
Woot!
Ingenious ideia, and very well executed as well. The way it handles the holes in pie charts using letters a-Z is pure genius. Kudos for the developer.
woohoo i might just use it soon, great idea
would you please add a vertical bar alternative, and a few other variations?
Hi there, does the font work in MS Word?
Alain, you’d better ask Travis Kochel (its creator).
But the prospects are not good, as on his web page he remarks
His font relies heavily on proper handling of Opentype features, and Miscrosoft is known not to be good at that.
Hi, I have installed the full package and followed the same instructions, but it doesn’t work….I have checked again all the steps and they are all ok, but the font is not changing into any graphical data…any idea why?
Designer: If you see only numbers then the Ligatures feature must be turned off.
Hi, I just downloaded the Chartwell Pies font and am trying to use it in InDesign. I have selected Discretionary ligatures and ligatures, but it’s still not become a pie chart. It’s only showing me the numbers. What do I need to change to get the pie chart to appear?
I had the same issue. You need to turn on Discretionary ligatures under the Open Type menu, not just Ligatures. Thought I was going mad :*)
I want to download FF chartwell font but don’t know from which site should I download it. Plz suggest some downloading sites.
Nisha: There is a link in the first paragraph of the article above that takes you to their page, where you can buy it. It is a commercial (paid) font.
I have purchased the Chartwell Pies font, but when I try to right click to make sure “ligatures” is checked, I don’t even see that option. I’ve entered ligatures into the help window and it shows no results. I’ve searched all my menus. What does this mean? I have both CS5 and CS6 (on Mac OS 10.10.2) and the missing is in both versions. Do I need some kind of plugin?
Brandy: No, the Ligatures feature is built into InDesign. Look in the Character panel menu, or in the Control panel menu (that’s the menu in the very far right side of the control panel)
Dear Mike,
Could you please describe step by step how you made an extruded version of the pie chart by converting a copy to outlines and reshaping the pieces into the sides of a cylinder with the Pen tool?
Many thanks,
Katie
Hi Katie-
I cover this topic in detail in my lynda.com InDesign FX course: https://ow.ly/LxDTP
The short version is that you need to make two copies of all the path segments in the bottom curve of the pie graph, move one set down and connect them to the second set (that you leave in place). So you end up with the original pieces plus closed paths for each of the side segments.
Not being able to use decimals pretty much kills it.
I have just downloaded Chartwell to Indesign 5. It appears in the fonts listing but not under Type Style. So when I go to highlight my text, hit the Chartwell Pies font, I only have ‘regular’ listed in the Type Style box.
Hi Mike, thanks for your blog post. I’ve found it super useful and it has *almost* saved my bacon on a job. The only issue is when I export to PDF using data merge the chart isn’t updated and stays the same throughout the document. Any ideas?
Can you explain in detail how you made the extruded version? I just purchased this font and learning how to use it.
Hi Pamela- First I converted the chart to outlines (make a copy first if you want to save the ability to edit the chart). Then for each wedge of the pie, I used the Direct Selection tool and clicked on a curved segment to select it. I copied and pasted in in place twice. Then I switched to the Selection tool, held Shift and dragged one of the new copies of the segment straight down. Then I connected the two copies with the Pen tool. Then I adjusted the fill color to make it a little darker so it would stand out from the original pie chart.
I’d like to ask my boss to purchase Chartwell for me. I’m new to InDesign and have struggled with adding charts created in Excel to InDesign documents for print. I have not found a way to do this where the chart looks professional enough for printing. Is there a way? If there is not, I’d like to be able to tell my boss this. Thank you.
Hi Crystal. Usually, to get charts from Excel to InDesign, you need to export the Excel file to PDF first, and then open the PDF in Illustrator. There you can change colors to CMYK, change the typeface, and so on. Then place the AI file into InDesign. I have a title on Lynda.com about converting Office formats to Adobe formats and vice-versa, if you want to see more details.
Managing Conversions Between Adobe CC and Microsoft Office
https://www.lynda.com/Acrobat-tutorials/Managing-Conversions-Between-Adobe-CC-Microsoft-Office/440650-2.html
Here’s the video you probably want to watch:
https://www.lynda.com/Acrobat-tutorials/Convert-Excel-charts-use-InDesign-Photoshop-Illustrator/440650/484393-4.html
Hello! I am very well versed in PS and AI. I’ve been trying to learn ID on my own. Your site has helped immensely! Thank you!
I have a new project that includes a pie graph and will require data merge. I’ve managed to create the pie graph and used the Knockout Group effect to make the center transparent. The pie graph flows accurately with the data. Yay! Now I’m stuck.
1) The pie representation isn’t in the same order as entered. Example: the data contains 60,15,25 or <>+<>+<>. When I preview, the graph seems to reorder ASC, so from the left I see 15,25,60. This isn’t a huge issue, but is there a way to output exactly as entered?
2) The graph requires labels (also using data merge) on the outside of the pie graph. I’ve been trying to figure out how to make the data merge labels move with the data merge pie graph fields and am ready to bang my head off the wall. Not really, but I’m a little frustrated. :)
I’ve been searching for tutorials and haven’t come across anything that will point me in the right direction. Would any of you happen to know of such a tutorial?
Good morning¡ Would somebody advise me a safe website to download the Chartwell Pie font for free on my Mac? I would really appreciated it. Or, if there is not such Webpage, where can I buy it, and how much?
Thank you
I’ve been using it in combination with XMPie to merge data in InDesign. You can tell XMPie to round the decimal numbers to whole numbers.
Another limitation is you can only go from 1 to 100. So if you are entering dollar amounts instead of percentages, the person setting up the data has to scale everything so the numbers don’t exceed 100.
But once you figure that out, it works.
Hi, Thanks so much for this post, looks great. One question – once you have your pie chart set up, are you able to ‘create outlines’ and edit segments of the pie within InDesign as if they were vector shapes? Or simply select segments using the direct selection tool?
I ask as I want to then apply patterns to segments using TeaCup’s PatterMaker. I realise it would mean I wouldn’t be able to go back on the pie date if the figures change in this instance but that’s ok.
Would be very grateful for any advice as need to get pie-making!
Sounds like you might want the Claquos 2 script. Check out this article: https://creativepro.com/5-ways-to-get-pie-charts-into-indesign.php
Hi, Thanks for reply. I actually just bought the Chartwell as needed to get going and found once pie is made you can select it as a text object and choose ‘create outlines’. It looks like it breaks up the pie but I’ve found I can easily reassemble it by cut and pasting each bit and then using smart guides to help snap it together. Then it is fully editable.
Might seem bit of a faff but it means I can stay completely within InDesign and save backing and forth to Illustrator.
A lot of pies I do are just straight coloured pies that don’t need any further work so Chartwell will save me a lot of time to do those very easily now.
Hi, I bought this font , but no matter what values I key in the pit chart looks wonky. How can I fix this?
* sorry I meant to write ‘pie chart’
Hi,
Is there a way to have labels applied to a chart with extending lines without manually placing them for each chart?
Good Afternoon,
I am in a bit of a time crunch and need help with some very direct indesign chartwell font directions.
1.) How do I make the data merged text boxes move with the coinciding color part of the pie chart so I am not having to move the text boxes every time to output to one pdf…I want the pie chart to move with the % labels.
2.) when I export the entire data merged document, the pie chart stays static and doesn’t change…how do I fix this?
Thank you kindly!
Hello! I have a client that wants to purchase this product. How do I purchase Chartwell? It would be for a Microsoft Windows 10 machine and the user already owns InDesign. Thank you for your help.
Hello- I have a client that wants to purchase your product Chartwell. She already has InDesign. Her pc is Windows 10. Please let me know how I can purchase this software. Thank you.
This is not a software. It’s a font and everything is explained at the main post and also in some comments below :)
Hi,
I’m loving Chartwell but I’m trying to outline a ring pie chart and it’s reverting to full pie once outlined. Is there a different process?
And now my black is vanishing from my pie chart… It’s identified. Others experiencing these quirks or is it user error?
Hello – How can I use a negative number using Chartwell Line Font? It works with “+” but when using a “-” all I get is a line.
I need to show a monthly report but what if a specific month is less than the previous?